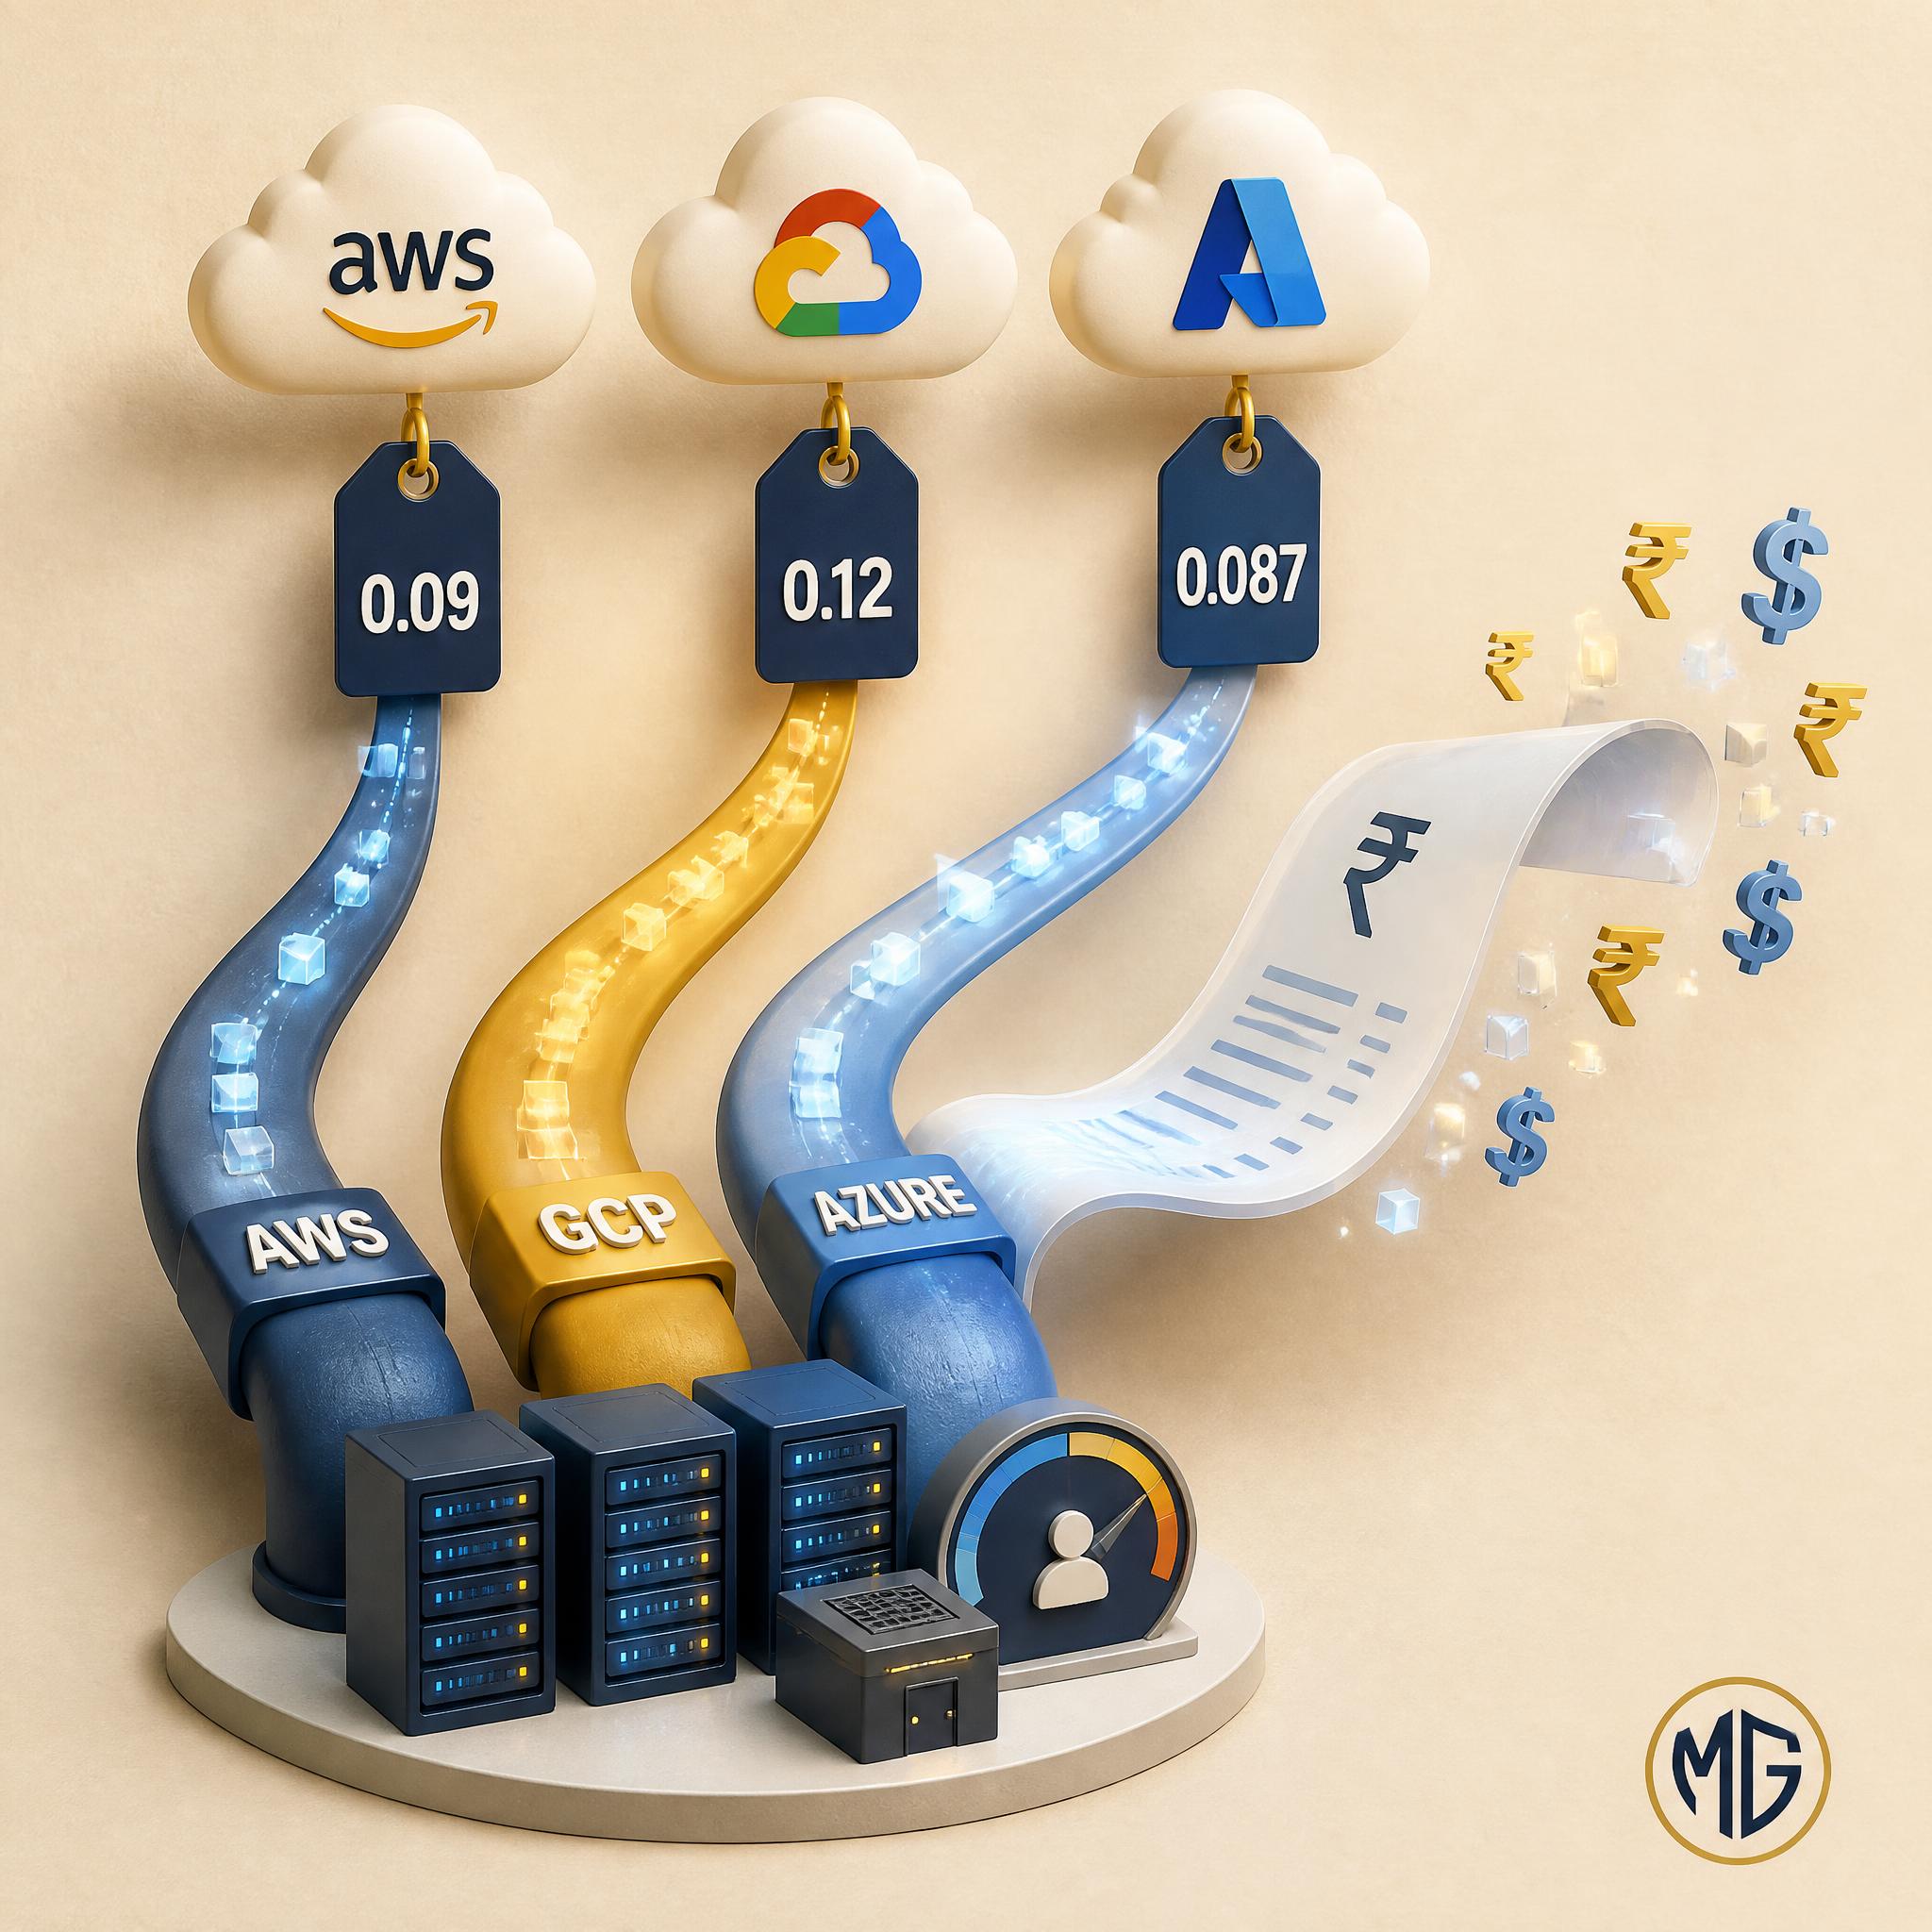
Azure bandwidth egress pricing Asia per GB 2026 starts at $0.12 for the first 10 TB a month. The same bytes leaving a North American or European region cost $0.087. That is roughly 38 percent more for being in the wrong half of the world, and it is the number most teams in Bengaluru, Chennai, Mumbai and Singapore never look up before they commit to an architecture.
This is the Asia view of cloud egress. What Azure, AWS and Google Cloud actually charge per gigabyte when your region sits in Asia, the three line items that surprise an India or Singapore team on the first real bill, and the decision rule for choosing between them at seed stage. Every rate below is sourced to the provider's own public pricing page and linked inline.
This is not a tour of every egress concept in every cloud. It is the version for a founder or first engineer picking a provider this month, with users in India or South East Asia, who wants to know what the traffic costs and what breaks if the choice is wrong.
Azure bandwidth egress pricing Asia per GB 2026, defined
Azure bandwidth egress pricing Asia per GB 2026 is the per-gigabyte rate Microsoft charges for data leaving an Azure region in Asia or Oceania for the public internet. Microsoft prices by the bandwidth zone the data leaves from, not by where it lands. Every Indian region, Southeast Asia, East Asia, Japan, Korea, Australia and Qatar Central sit in Zone 2. The first 100 GB each month is free in every zone. After that, Zone 2 internet egress is $0.12 per GB for the first 10 TB. Zone 1, North America and Europe, starts at $0.087 per GB. Microsoft's bandwidth pricing page carries the live table.
Inbound traffic is free everywhere. You pay by the gigabyte that leaves. That asymmetry is cloud networking economics in one sentence, and it is why an architecture that looks cheap on paper arrives with a bill nobody modelled.
Who this is for, and who can stop reading
This is written for a team of 5 to 40 people, running production in an Asian region, moving 500 GB to 50 TB of outbound traffic a month. At that size egress is large enough to notice and small enough that one architectural decision still changes it.
Under 100 GB a month you sit inside the free allowance on both Azure and AWS, so spend the hour elsewhere. Above 100 TB a month you are past list pricing and into a committed-spend conversation, where these rates are the opening position you negotiate down from.
Practitioner opinion: the worst moment is just after a launch, when traffic has grown tenfold and nobody has read the data transfer line because compute is still larger. By the time it is not, the architecture generating it is load bearing.
Why Asia pays more on Azure: the zone map
Azure splits its regions into bandwidth zones and the zone decides the rate. Zone 1 is North America and Europe. Zone 2 is Asia and Oceania, which is where Central India, South India, West India, Southeast Asia, East Asia, Japan East, Japan West, Korea Central, Korea South, Australia and Qatar Central all sit. Zone 3 covers other markets and prices higher again.
At the entry tier the gap is $0.12 against $0.087 per GB, so about 38 percent. The published Zone 2 tiers then step down as monthly volume rises, through roughly $0.085 per GB between 10 and 50 TB and $0.082 per GB between 50 and 150 TB, converging toward the Zone 1 band at high volume. Read the tier table on the bandwidth pricing page before you budget, because the bands move and the entry tier is the one most seed-stage teams live in.
The takeaway: on Azure the premium is paid at low volume, which is exactly where a seed-stage company sits. It is worst on day one, not later.
AWS egress cost from Mumbai and Singapore
AWS also prices by source region. Data transfer out to the internet from us-east-1 is $0.09 per GB for the first 10 TB a month. From Asia Pacific (Mumbai), ap-south-1, the same first tier is $0.1093 per GB. The first 100 GB a month is free across the account. The EC2 on-demand page carries the data transfer table, and S3 pricing uses the same tiering for object downloads, which is why an S3-heavy product and an EC2-heavy product end up with the same per-GB egress cost.
Two numbers matter more than the headline rate. Cross-zone traffic inside one region is $0.01 per GB in each direction, so $0.02 for a round trip. Inter-region traffic on the same continent is around $0.02 per GB, rising to the $0.08 to $0.09 band from Mumbai to a North American region.
CloudFront changes the shape rather than the rate. India CloudFront pricing per GB is in the same neighbourhood as direct egress, but an origin fetch from S3 to CloudFront is free, so the saving comes from cache hit ratio. CloudFront pricing reads next to the EC2 table, not instead of it. If your bill already jumped and nobody knows why, the triage runbook for a doubled AWS bill walks the same line items in order.
GCP egress cost and GCS egress cost: priced by where your users are
Google Cloud is the structural outlier and this is the single most useful thing to know about it in an Asian context. Google prices Premium Tier internet egress by destination, not by source region. Running in asia-south1 rather than us-central1 does not, on its own, raise your internet egress rate. What raises it is where your users sit.
Premium Tier internet egress is tiered by monthly volume, starting around $0.12 per GB for the first TB, about $0.11 per GB from 1 to 10 TB, and about $0.08 per GB above 10 TB for the main destination band, with Australia and China priced separately and higher. VPC network pricing is the reference. Standard Tier is cheaper per GB but routes over the public internet rather than Google's backbone, and the network tiers page sets out the tradeoff.
GCS egress cost follows the same network rates for internet downloads, so object storage is not a separate regime. The takeaway: with users and workload both in India, GCP is the one provider where the Asia premium is not automatic. With users in Australia, it bites hardest there.
The three line items that surprise an India or Singapore team
None of these three sits next to the per-GB rate on a pricing page, and all three land on a real invoice. They are why a modelled bill and an actual bill diverge.
One: the tax that is not on the price page
Cloud and IaaS services attract 18 percent GST in India. For a business with a GSTIN, the usual treatment on a foreign supplier invoice is the reverse charge mechanism: the supplier does not add GST, the buyer self-assesses it, pays it, and normally claims it back as input tax credit. India Briefing's summary of GST on cloud and SaaS sets out the mechanics. Singapore applies 9 percent GST to imported digital services under the overseas vendor registration regime, per IRAS.
The honest version is not that your bill is 18 percent higher. For a registered company it is a cash-flow and compliance cost, and the credit depends on clean filings. For an unregistered entity, or non-creditable spend, it is a real 18 percent. Confirm your position with your accountant, not with a blog post.
Two: inter-AZ traffic, the high availability tax
Cross-zone traffic inside one region is $0.01 per GB on all three providers. That is the smallest number on the page and frequently the largest line, because every multi-AZ database replica, every Kafka broker spread across zones, and every Kubernetes service call that lands on a pod in another zone generates it continuously whether or not a user did anything.
A three-zone Kafka cluster at replication factor three ships every produced byte to two brokers in other zones. At 100 MB per second that is roughly 17 TB a day, charged to the networking line rather than the managed-Kafka line, which is why it hides. The multi-AZ versus single-region tradeoff is a resilience decision with a networking bill attached, and it deserves to be made deliberately.
Three: the replica you put in a US region
The common Asia-specific surprise is a read replica or analytics warehouse in a North American region, fed continuously from a primary in Mumbai or Singapore. That is cross-region egress out of an Asian source, the most expensive non-internet rate on the sheet, running around the clock at a volume set by write throughput rather than user activity.
The fix is rarely to delete the replica. Ship a summarised stream rather than raw change data, or move the analytics side into the same region as the primary. Either way, decide before the first invoice.
Azure versus AWS versus Google Cloud in Asia: the decision rule
At the first tier, from an Asian region to the internet, Azure Zone 2 is $0.12 per GB, AWS Mumbai is $0.1093 per GB, and Google Cloud Premium Tier is around $0.12 per GB for the first TB. Those are close enough that egress alone should not decide your provider. The shape of the pricing should.
The decision rule, stated plainly:
- Users concentrated in India or South East Asia, workload in Asia. Google Cloud is structurally favourable because it prices by destination, so an Asian region costs you nothing extra by itself.
- Users spread worldwide, workload in Asia, heavy object downloads. AWS with CloudFront in front of S3, because the origin pull is free and the cache ratio becomes the lever.
- Already on Microsoft contracts, workload in Asia, volume under 10 TB. Azure costs you the Zone 2 premium at exactly the volume where it is largest. Budget for it explicitly rather than discovering it.
- Egress-dominant workload, media or large files. None of the three. Put the bytes on a zero-egress object store and keep compute where it is.
What breaks if you pick wrong is rarely the budget in month one. It is the migration in month eighteen, when the egress-heavy component is wired into everything else.
A worked example: 15 people, Bengaluru, 4 TB a month
A B2B SaaS team of 15 in Bengaluru, production in Azure Central India, serving 4 TB of outbound internet traffic a month, plus 1.5 TB of cross-zone traffic from a highly available Postgres pair and an internal message bus.
Internet egress is 4,000 GB less the free 100 GB, so 3,900 GB at $0.12, which is $468 a month and $5,616 a year. Cross-zone traffic is 1,500 GB at $0.01, which is $15 a month. Total networking, $483 a month before tax.
Run the identical workload out of a Zone 1 region and the internet egress becomes 3,900 GB at $0.087, which is $339.30 a month. The difference is $128.70 a month, about $1,545 a year, for byte-for-byte identical traffic. On AWS Mumbai the same 3,900 GB is $426.27 a month.
Now cache. If 70 percent of that traffic is cacheable, origin egress drops to roughly 1,170 GB. The CDN bills its own per-GB rate, similar in India, so the saving is not the rate: repeat requests never touch the origin, and on AWS the origin fetch is free. Practitioner opinion: cache hit ratio is the only egress lever that compounds, and the one most teams never measure.
What the EU Data Act does not do for an Asian team
The regulation that gets quoted in every egress article is the EU Data Act, Regulation (EU) 2023/2854. Article 29 removes switching charges, including data egress charges for the switching process, from 12 January 2027. Between 11 January 2024 and that date a transitional rule caps switching charges at the provider's directly incurred costs. The switching provisions themselves have applied since 12 September 2025.
Read what it covers: the act of leaving a provider, for data processing services in the EU. It does not touch the egress you pay daily, meaning user downloads, webhook calls, cross-cloud replication and API responses. An India or Singapore company serving Asian users is outside its scope for its operating bill in any case.
The headlines announcing free cloud egress were about switching costs, not operating costs. Treat it as a cheaper future migration, and budget monthly networking as if nothing has changed.
The zero-egress escape hatch, and what it costs you
If object downloads dominate your bill rather than API traffic, move the objects to a store that does not charge egress at all. Cloudflare R2 charges $0 for egress, $0.015 per GB-month for standard storage, $0.01 per GB-month for infrequent access, and operations at $4.50 per million Class A and $0.36 per million Class B, with a free tier of 10 GB. Backblaze B2 charges $0.01 per GB for egress with a free allowance tied to stored volume.
What you give up is adjacency. Compute stays where it is, so every application-side read crosses a boundary that used to be free, and integrations assuming S3 or GCS need checking one by one. For a download-heavy product the arithmetic is usually decisive. For a transactional SaaS with modest object traffic it rarely is.
Four moves that actually move the Asia egress bill
- Measure cross-zone before internet. Run flow logs for a week and split the data transfer line into internet, inter-region and inter-AZ. The ranking is rarely what teams assumed.
- Put a CDN in front of everything cacheable, then measure hit ratio. The CDN is not a discount. The cache hit is.
- Use topology-aware routing in Kubernetes. Keeping a call graph inside one zone removes cross-zone charges on the hottest internal paths, at a resilience cost you should name out loud.
- Alert on the shape, not the total. A per-service data transfer alert catches a misconfigured webhook fanout in a day rather than at month end. Anomaly detection on cloud spend covers how to wire one without a vendor.
None of these is a rewrite. All four are a week of work at most, and the first is free.
The summary table
| What you are paying for | Azure, Zone 2 Asia | AWS, ap-south-1 Mumbai | Google Cloud, Premium Tier |
|---|
| Internet egress, first tier | $0.12 per GB, first 10 TB | $0.1093 per GB, first 10 TB | About $0.12 per GB, first TB |
| Free monthly allowance | 100 GB, every zone | 100 GB, account wide | Product specific, check the page |
| What sets the rate | The region you send from | The region you send from | The destination your users are in |
| Cross-zone, same region | $0.01 per GB | $0.01 per GB each direction | $0.01 per GB, sender side |
| Equivalent Zone 1 or US rate | $0.087 per GB | $0.09 per GB, us-east-1 | Same rate, destination driven |
| Main structural lever | Front Door or a third-party CDN | Free S3 to CloudFront origin fetch | Standard Tier, or Cloud CDN |
Rates checked against the linked provider pages in the first week of October 2026. List prices move without announcement, so the linked page is the authority and this table is the map.
Stage by stage: pre-seed, seed, Series A
Pre-seed, under 1 TB a month. Egress is under $120 on any of the three and the free allowance covers a real fraction. Do not optimise. Do put a CDN in front of static assets now, because it costs nothing and caps the surprise later, and do turn on a billing alert.
Seed, 1 to 20 TB a month. The Asia premium is largest here in percentage terms, and cross-zone traffic usually overtakes expectations. Measure the split, fix the cache ratio, and look hard at any replica on another continent. The cost reduction playbook for a seed-stage Indian startup covers the surrounding line items in the same order.
Series A, above 20 TB a month. Committed-use discounts and private connectivity become real levers and list rates become an opening position. If the workload is egress dominant, model a zero-egress object store now. Teams weighing the provider choice itself will find the AWS versus GCP comparison for Indian fintech useful on the regulatory side of the same decision.
Where to go from here
The fastest honest first pass is an hour with your own bill: filter the data transfer line by usage type, rank internet against inter-region against inter-AZ, and compare the top line to the per-GB rates above. If the ranking surprises you, that surprise is the project.
MatrixGard runs fractional DevSecOps for early-stage teams, funded or bootstrapped: cloud, infrastructure and security on a retainer rather than three hires. For a second pair of eyes on the networking bill and the security posture together, the free cloud readiness checklist takes about ten minutes.
About the author
Avinash S is the founder of MatrixGard, a fractional DevSecOps practice for early-stage startups. He works on cloud architecture, cost and security posture for teams that are too small for a dedicated infrastructure hire and too exposed to go without one.
Methodology and sources
Every per-GB figure is attributed to the provider's own public pricing page, linked inline at the point of use, and was checked in the first week of October 2026. Where a figure is an approximation because the table is tiered or destination dependent, the text says so.
Regulatory claims are sourced to the primary text: the EU Data Act is Regulation (EU) 2023/2854 and the switching-charge provision is Article 29. Tax treatment is summarised from published guidance and is not advice.
Nothing here describes a MatrixGard client, engagement or outcome. Where a judgement is ours rather than a sourced fact, it is labelled practitioner opinion. The worked example is an illustrative calculation from the published rates above, not a real customer bill.