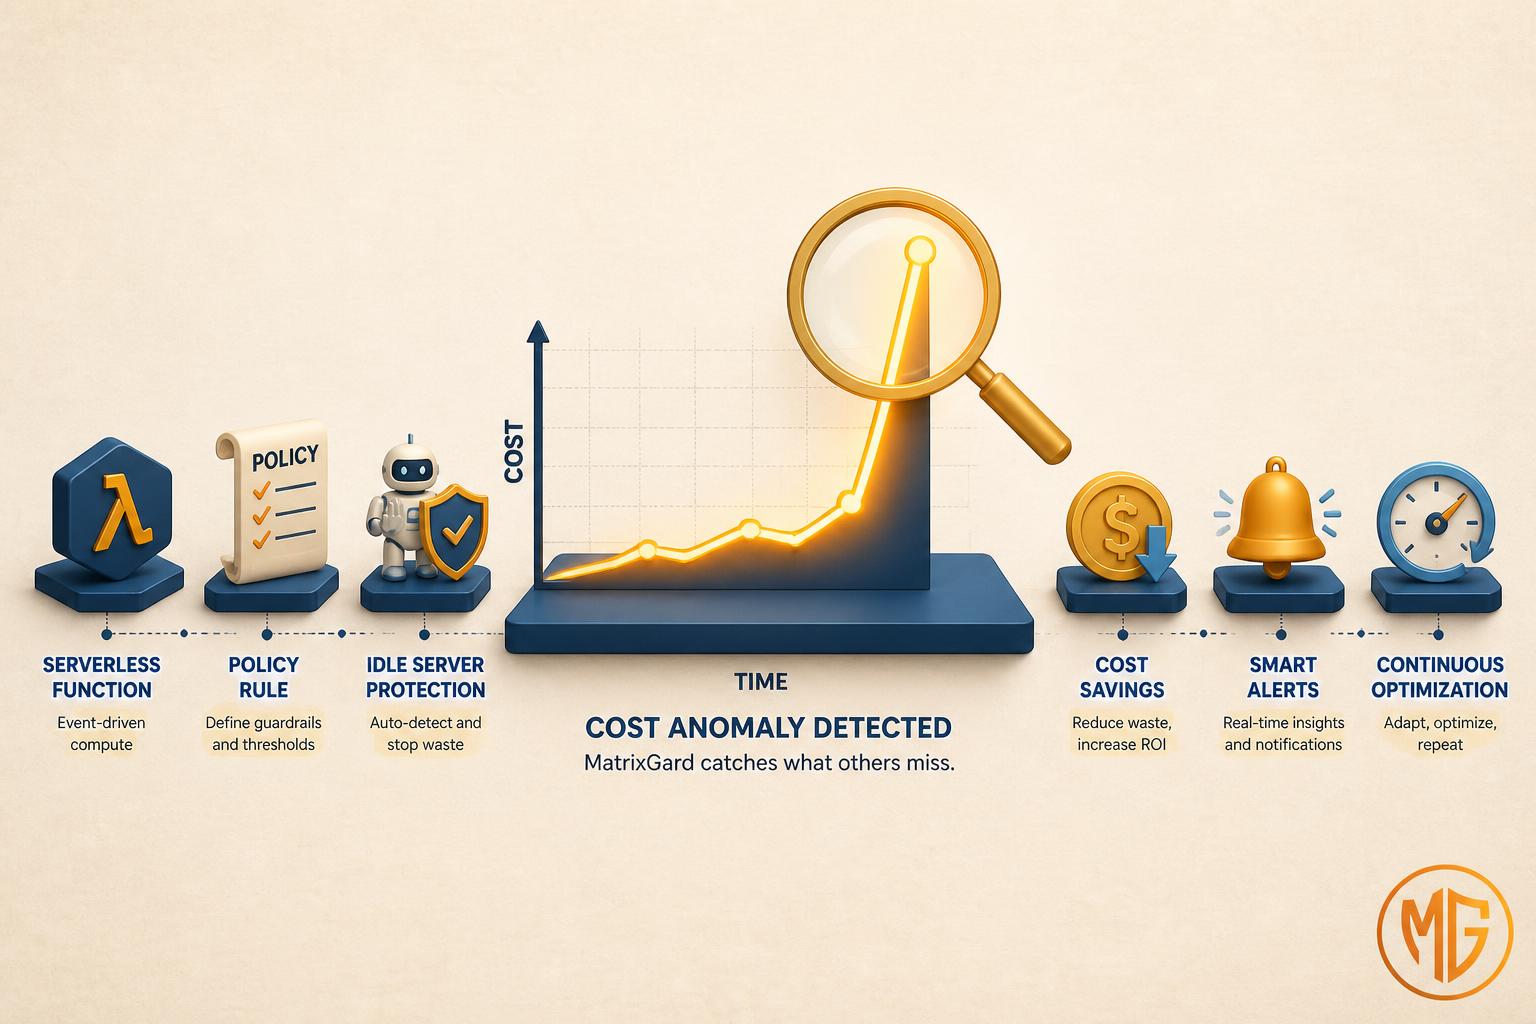
Every startup founder has had the same bad morning. The cloud bill for the month lands, or the billing alert fires, and it is 40 percent higher than last month with no obvious reason. Someone left a GPU instance running. A misconfigured cron re-ran a data export a thousand times. A test environment never got torn down. By the time you notice, the money is already spent.
This post is for the founding engineer or fractional platform person who wants an early-warning system for exactly that, without paying for a commercial FinOps platform and without building a machine-learning team. It walks through a free, open-source cost anomaly pipeline built from two boring, reliable pieces: Cloud Custodian for policy-as-code detection and remediation, and AWS Lambda for the serverless glue that runs it on a schedule.
Most articles on cost anomaly detection either sell you a SaaS dashboard or hand-wave about "using ML." This one is an architecture you can stand up in an afternoon, that runs inside the AWS free tier, and that you fully own. Where I state opinion rather than documented fact, I label it. Everything else cites the provider or project documentation.
Quick context: the 2026 state of cloud cost tooling
Both major clouds ship native anomaly detection now. AWS offers AWS Cost Anomaly Detection, a free service that uses machine learning to model your historical spend and alert on deviations. GCP has cost anomaly detection built into its billing reports. Azure has Cost Management alerts. These are genuinely useful and you should turn them on today, because they cost nothing.
But they share a limitation that matters for a small team: they tell you the bill moved, not what to do about it. A native alert says "your EC2 spend is anomalous by 3 standard deviations." It does not say "instance i-0abc in ap-south-1 has been running idle for six days, here is the tag, here is the owner, and I have stopped it for you." Closing that gap between detection and action is where a lightweight custom pipeline earns its keep, and where Cloud Custodian fits.
1. Native anomaly detection is necessary but not sufficient
Start with the free native services, always. AWS Cost Anomaly Detection lets you define monitors scoped by service, account, or cost-allocation tag, and routes alerts to email or an Amazon SNS topic. The documentation is clear that the underlying model learns your unique spend pattern rather than using a fixed threshold, which means it adapts to a startup whose baseline is genuinely growing month over month.
The gap is attribution and action. The native alert is a signal that something is wrong at the service level. It rarely points at the specific resource, almost never at the owner, and by design never remediates. For a 50-person enterprise with a FinOps team that gap is fine, because a human picks up the alert and investigates. For a five-engineer startup where nobody owns cost, the alert lands in an inbox nobody reads and the idle resource keeps burning money for another two weeks.
Takeaway: turn on native anomaly detection first, treat it as your macro tripwire, and build the attribution-and-action layer separately. The two are complementary, not competing.
2. The architecture at a glance
The pipeline has three logical stages. First, a scheduled detector reads recent spend from the Cost Explorer GetCostAndUsage API, compares it against a rolling baseline, and decides whether today looks anomalous. Second, when it does, a set of Cloud Custodian policies run to find the specific resources most likely responsible: idle instances, unattached volumes, oversized NAT gateways, orphaned load balancers, snapshots that never got cleaned up. Third, an action-and-alert stage notifies a human and, for the safe categories, remediates automatically.
All three stages run as scheduled AWS Lambda functions triggered by Amazon EventBridge Scheduler. No servers, no always-on container, no Kubernetes. The detector runs once or a few times a day; Cloud Custodian policies run on the same cadence or on demand when the detector trips. The entire thing is defined in code: YAML policies for Custodian, a small Python detector, and an infrastructure-as-code template to deploy it.
Takeaway: keep the three stages loosely coupled. Detection, attribution, and action should be separate functions so you can tune, test, and disable each independently rather than shipping one monolithic script.
3. Getting the cost signal: Cost Explorer versus the CUR
There are two public ways to read your AWS spend programmatically, and the choice shapes the whole detector. The Cost Explorer GetCostAndUsage API returns aggregated cost and usage grouped by dimensions like service, region, or tag, with daily granularity, in a single API call. It is the fast path for a detector because you can ask "give me daily EC2 cost for the last 30 days grouped by tag" and get a small JSON response. Note that each paginated Cost Explorer request carries a small per-request charge, so a once-a-day detector is cheap but a per-minute poll is not.
The Cost and Usage Report (CUR) is the other option: the most granular billing data AWS produces, delivered as files to an S3 bucket, down to the individual line item and resource ID. It is the right feed for deep attribution because it can name the exact resource, but it is heavier to parse and lands hours after the usage. My recommendation for a startup detector: use Cost Explorer for the fast daily anomaly signal, and reach for the CUR only when you need resource-level attribution that the API cannot give you.
Takeaway: default to the Cost Explorer API for the detection loop because it is small and fast, and keep the CUR in your back pocket for forensic, resource-level drilldown.
4. The detection logic: statistics, not machine learning
You do not need a model to catch the anomalies that actually hurt a startup. The failure modes are large and abrupt: a bill that doubles, a service that appears from nowhere, a region you have never used lighting up. Simple statistics catch all of these. Pull the last 14 to 30 days of daily cost per service, compute a rolling mean and standard deviation over a trailing window, and flag any day where today's cost exceeds the mean by more than a chosen number of standard deviations. A z-score threshold between 2.5 and 3 is a reasonable starting point; tune it against your own noise.
Layer two cheaper checks on top. A day-over-day percentage jump above a fixed ceiling (say 50 percent for any single service) catches sudden spikes that a slow-moving baseline would smooth over. A "new service" check flags any service line that had zero cost for the trailing window and is now non-zero, which is how you catch someone spinning up SageMaker or a managed database nobody approved. These three rules together, in maybe 60 lines of Python, catch the overwhelming majority of real cost incidents. Practitioner opinion: reach for a learned model only after this rule set has been running long enough to show you which false positives it actually produces.
Takeaway: start with z-score, day-over-day delta, and new-service detection. It is boring, explainable, and it catches the expensive mistakes. Add sophistication only when the simple version proves inadequate.
5. Cloud Custodian: from signal to specific resource
Cloud Custodian is an open-source, rules-as-code engine for cloud governance, originally built at Capital One and now a CNCF project. You write policies in YAML that describe a resource type, a set of filters, and a set of actions. The engine queries your account for resources matching the filters and applies the actions. It reads like plain intent: find every EC2 instance whose average CPU over the last four days is under 5 percent and that is not tagged as an exception, then notify and stop it.
For cost anomaly work, Custodian is the attribution layer. When the detector flags an EC2 spike, a Custodian policy enumerates the actual instances driving it. When storage cost jumps, a policy finds the unattached EBS volumes and the snapshots older than your retention window. The policy library in the docs covers the usual cost offenders directly: idle instances, unused elastic IPs, orphaned volumes, underutilised RDS databases. You are assembling from documented building blocks, not inventing detection logic.
Takeaway: let Cloud Custodian answer the question native alerts cannot, which is "which exact resources, owned by whom." Its filter-and-action model maps cleanly onto the common cost-waste categories.
6. Running it serverless with Lambda and EventBridge
Cloud Custodian has a first-class serverless mode. Instead of running the CLI from a laptop or a cron box, you set a policy's mode to periodic and Custodian deploys the policy as its own AWS Lambda function on an EventBridge schedule. The policy provisions and updates the Lambda for you on custodian run. That means your whole governance layer is serverless by construction, with no compute to babysit.
The detector is a separate small Lambda you write yourself, also on an EventBridge Scheduler trigger. When it detects an anomaly it can publish to an SNS topic or directly invoke the relevant Custodian-managed function. Package the detector with its dependencies, give its execution role the narrow permissions it needs (Cost Explorer read, SNS publish, and nothing else), and let EventBridge run it daily. This is the classic event-driven pattern the Lambda documentation is built around, applied to cost instead of application traffic.
Takeaway: use Custodian's native periodic Lambda mode for the policies and a small hand-written Lambda for the detector. Nothing in this pipeline needs a server that runs all day.
7. Alerting that a human will actually act on
Detection without a good alert is just a log nobody reads. The pipeline should route findings to where your team already lives. The simplest path is an Amazon SNS topic with email or an HTTPS subscription to a chat webhook. Cloud Custodian also ships c7n-mailer, a companion tool that turns policy actions into formatted notifications over email, Slack, or other transports, with the resource details and tags rendered inline.
The content of the alert is what separates useful from ignored. A good anomaly alert names the service, the size of the jump in both percentage and absolute currency, the specific resources Custodian identified, their tags including owner where present, and the action taken or proposed. Practitioner opinion: put the money figure in the first line. "EC2 up 62 percent, roughly 180 dollars over baseline, 3 idle instances found" gets read; "cost anomaly detected in monitor X" gets archived.
Takeaway: send alerts to the channel your team watches, and front-load the currency amount and the named resources. The alert should be a decision, not a mystery to investigate.
8. Guardrails: making auto-remediation safe
Automatic remediation is powerful and dangerous in equal measure. A policy that stops idle instances will, on the day your tagging is wrong, stop something that mattered. The discipline that makes this safe is staged rollout. Run every new policy in notify-only mode first, where the action is purely a notification and nothing is touched. Watch its findings for a week. Only once you trust that a given policy category is not producing false positives do you promote it to an enforcing action.
Two more guardrails matter. First, an exception tag that any resource can carry to opt out of automated action, so an engineer can protect a deliberately-idle box without editing your policies. Second, prefer reversible actions. Stopping an instance is reversible; terminating it is not. Detaching a volume is recoverable; deleting it is not. Let automation handle the reversible, cost-saving actions and let the destructive ones stay a human decision surfaced by the alert. Cloud Custodian's filters make the exception-tag pattern trivial: add a filter that excludes any resource carrying your opt-out tag.
Takeaway: ship every policy in notify-only mode first, honour an opt-out tag, and reserve irreversible actions for humans. Automation should save money, never cause an outage.
9. What it costs, and where it stops being enough
The running cost is close to zero for a startup. AWS Lambda's free tier includes one million requests and 400,000 GB-seconds of compute per month; a handful of functions running a few times a day uses a rounding error of that. EventBridge Scheduler and SNS have generous free tiers of their own. The one line item to watch is the Cost Explorer API, which charges per paginated request, so keep the detector to a small number of daily calls rather than a tight polling loop. In practice the pipeline costs a few cents a month to run.
Be honest about the ceiling. This pipeline catches abrupt, large, resource-level anomalies, which are the ones that hurt a small team most. It is not a substitute for a mature FinOps practice: it does not do unit-economics attribution, showback and chargeback across teams, commitment-purchase optimisation, or forecasting. When you cross roughly 50 engineers and multiple product lines, a dedicated FinOps platform or a person who owns cost full-time becomes worth the money. Until then, this free pipeline covers the failure modes that actually happen. Practitioner opinion: most early-stage startups, funded or bootstrapped over-buy FinOps tooling years before they have the spend to justify it.
Takeaway: this is a high-leverage, near-free control for the pre-seed-to-Series-A window. Graduate to commercial FinOps tooling when your org size and spend genuinely outgrow rule-based detection.
The summary table
| Pipeline stage | Component | Job | Cost |
|---|
| Macro tripwire | Native anomaly detection | Service-level "something moved" signal | Free |
| Detection | Lambda + Cost Explorer API | Daily z-score, delta, new-service checks | Free tier plus per-request cents |
| Attribution | Cloud Custodian policies | Name the exact resources and owners | Free (open source) |
| Scheduling | EventBridge Scheduler | Run detector and policies on cadence | Free tier |
| Action | Custodian actions, staged | Notify, then remediate reversibly | Free |
| Alerting | SNS or c7n-mailer | Currency-first alert to the team channel | Free tier |
The recommendation by stage
Pre-seed, under 10 engineers: turn on native anomaly detection and build the minimal version: a single detector Lambda plus three or four Custodian policies for idle instances, unattached volumes, and orphaned load balancers, all in notify-only mode. That alone will catch the incidents that would otherwise cost you a week of runway.
Seed, 10 to 30 engineers: promote the trusted policies from notify-only to enforcing, add the opt-out tag convention, and route alerts into your team chat with c7n-mailer. Extend coverage to RDS, snapshots, and NAT gateways. This is the sweet spot where the pipeline pays for itself repeatedly.
Series A and beyond: keep the pipeline as your fast rule-based layer but start evaluating a dedicated FinOps platform for the things rules cannot do: unit economics, chargeback, and commitment optimisation. The open-source pipeline becomes the cheap first line of defence rather than the whole strategy.
If you want a second set of eyes on your cloud spend
I run a free 20-minute cloud review for early-stage founders, funded or bootstrapped. Bring your AWS or GCP bill and your architecture, and I will give you an honest read on where the waste is and what a lightweight control like this would catch for you. No NDA needed for the first conversation. Send a note.
Avinash S is the founder of MatrixGard. Fractional DevSecOps for early-stage startups, funded or bootstrapped across India, the GCC, the UK, and the US. Almost a decade of building, breaking, and securing cloud infrastructure on AWS and GCP.
Methodology note. Architecture and component references are drawn from public AWS documentation (Cost Anomaly Detection, Cost Explorer API, Cost and Usage Report, Lambda, EventBridge Scheduler, SNS, and Lambda pricing) and the public Cloud Custodian project documentation as of July 2026. Free-tier figures are AWS-published and shift over time; verify current limits against the pricing pages before you rely on them. Detection thresholds and staged-rollout practices are my operational opinion, labelled inline, and reasonable practitioners will tune them differently.